Support Vector Machine#
Support Vector Machine (SVM) is a powerful supervised learning algorithm commonly used for classification tasks, although it can also be adapted for regression. The key idea behind SVM is to find the optimal hyperplane that best separates different classes in the feature space.
Interactive demo of SVM: https://greitemann.dev/svm-demo
import matplotlib.pyplot as plt
from sklearn import svm
from sklearn.datasets import load_iris
from sklearn.inspection import DecisionBoundaryDisplay
iris = load_iris()
_, ax = plt.subplots()
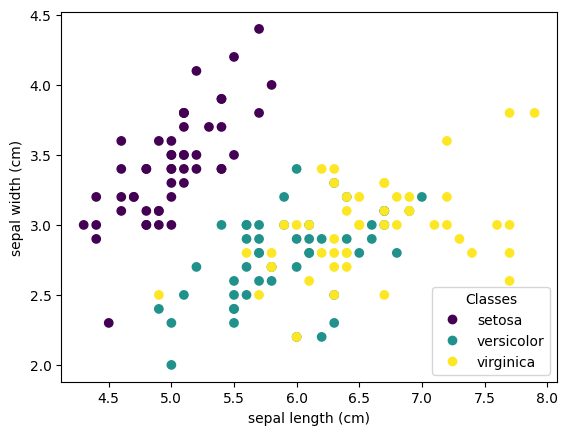
scatter = ax.scatter(iris.data[:, 0], iris.data[:, 1], c=iris.target)
ax.set(xlabel=iris.feature_names[0], ylabel=iris.feature_names[1])
_ = ax.legend(
    scatter.legend_elements()[0], iris.target_names, loc="lower right", title="Classes"
)

# Take the first two features. We could avoid this by using a two-dim dataset
X = iris.data[:, :2]
y = iris.target
C = 1.0  # SVM regularization parameter
models = (
    svm.SVC(kernel="linear", C=C),
    svm.LinearSVC(C=C, max_iter=10000),
    svm.SVC(kernel="rbf", gamma=0.7, C=C),
    svm.SVC(kernel="poly", degree=3, gamma="auto", C=C),
)
models = (clf.fit(X, y) for clf in models)
# title for the plots
titles = (
    "SVC with linear kernel",
    "LinearSVC (linear kernel)",
    "SVC with RBF kernel",
    "SVC with polynomial (degree 3) kernel",
)

# Set-up 2x2 grid for plotting.
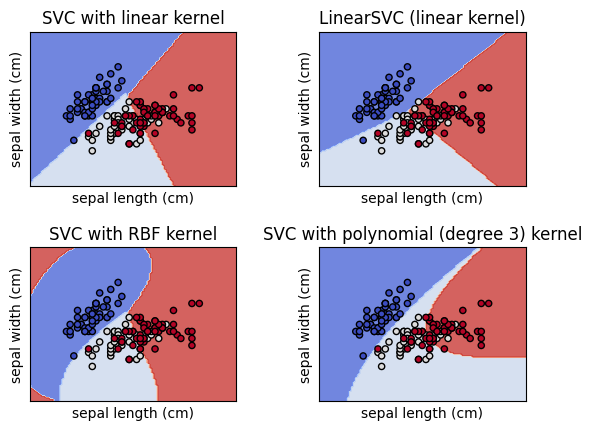
fig, sub = plt.subplots(2, 2)
plt.subplots_adjust(wspace=0.4, hspace=0.4)

X0, X1 = X[:, 0], X[:, 1]

for clf, title, ax in zip(models, titles, sub.flatten()):
    disp = DecisionBoundaryDisplay.from_estimator(
        clf,
        X,
        response_method="predict",
        cmap=plt.cm.coolwarm,
        alpha=0.8,
        ax=ax,
        xlabel=iris.feature_names[0],
        ylabel=iris.feature_names[1],
    )
    ax.scatter(X0, X1, c=y, cmap=plt.cm.coolwarm, s=20, edgecolors="k")
    ax.set_xticks(())
    ax.set_yticks(())
    ax.set_title(title)

plt.show()


