K-Means Clustering#
The KMeans algorithm clusters data by trying to separate samples in n
groups of equal variance, minimizing a criterion known as the inertia or
within-cluster sum-of-squares (see below). This algorithm requires the number
of clusters to be specified. It scales well to large numbers of samples and has
been used across a large range of application areas in many different fields.
The k-means algorithm divides a set of N samples X into
K disjoint clusters C, each described by the mean
of the samples in the cluster. The means are commonly called the cluster
“centroids”; note that they are not, in general, points from X,
although they live in the same space.
The K-means algorithm aims to choose centroids that minimise the inertia, or within-cluster sum-of-squares criterion:
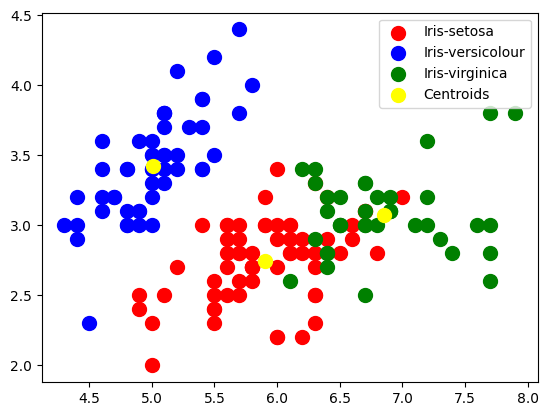
import matplotlib.pyplot as plt
from sklearn.cluster import KMeans
from sklearn.datasets import load_iris
iris = load_iris()
X = iris.data
kmeans = KMeans(n_clusters=3, init="k-means++", max_iter=300, n_init=10, random_state=0)
y_kmeans = kmeans.fit_predict(X)
plt.scatter(
    X[y_kmeans == 0, 0], X[y_kmeans == 0, 1], s=100, c="red", label="Iris-setosa"
)
plt.scatter(
    X[y_kmeans == 1, 0], X[y_kmeans == 1, 1], s=100, c="blue", label="Iris-versicolour"
)
plt.scatter(
    X[y_kmeans == 2, 0], X[y_kmeans == 2, 1], s=100, c="green", label="Iris-virginica"
)

# Plotting the centroids of the clusters
plt.scatter(
    kmeans.cluster_centers_[:, 0],
    kmeans.cluster_centers_[:, 1],
    s=100,
    c="yellow",
    label="Centroids",
)

plt.legend()
<matplotlib.legend.Legend at 0x136b21490>


